
Guide to Forex Trading Companies in Kenya
Explore forex trading in Kenya with our detailed guide 🏦. Learn to pick the right brokers, understand regulations, and trade confidently in the local market 📊.
Edited By
Ethan Roberts
Resistance and support are fundamental concepts in forex trading that every trader should master. These terms refer to price levels where market forces, such as supply and demand, tend to halt or reverse price movements. Understanding these levels helps you make better trading decisions and manage risks effectively.
Support is the price level where demand tends to prevent the price from falling further. Imagine a currency pair, say USD/KES, dropping steadily until it reaches a point where buyers step in strongly. This level creates a "floor" that the price struggles to break below. For example, if USD/KES drops to 110 and consistently bounces back, that 110 level becomes a support.
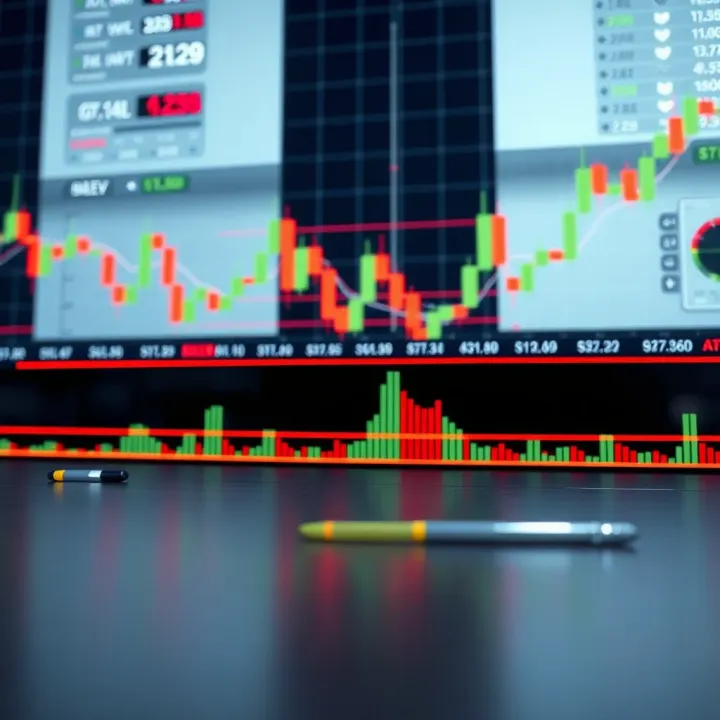
On the other hand, resistance is a price point where selling pressure tends to stop the price from climbing higher. Think of it as a "ceiling". If the USD/KES pair rises to 115 but gets pushed down repeatedly, 115 is a resistance level.
These levels are not exact but zones where price action shows repeated hesitation or reversal.
Here are common ways to identify these critical price areas:
Historical Price Data: Look for past highs and lows where price stalled.
Moving Averages: Popular averages like the 50-day or 200-day often act as dynamic support or resistance.
Trend Lines: Drawn diagonally, these connect price highs or lows, signalling potential support/resistance in trending markets.
Psychological Levels: Round numbers or whole prices such as 100, 105, or 110 often attract traders’ attention.
Resistance and support provide clues about supply and demand balance in the market. When price approaches these levels, traders watch closely for signs of a breakout or reversal. For example, breaking above resistance at 115 might suggest bullish momentum, signalling a good chance to buy. Conversely, failure to break resistance could mean a sell opportunity.
Recognising these price zones can also help you set stop-loss orders or profit targets. For instance, setting a stop-loss just below a known support reduces losses if price drops further.
By learning to spot resistance and support, you get a clearer view of market psychology, enabling smarter trades in forex markets such as USD/KES, EUR/USD, or GBP/USD.
This foundation sets the stage for using more advanced tools and strategies tailored to Kenyan forex traders, helping you trade with more confidence and better risk control.
Resistance and support are fundamental concepts that help traders predict potential price movements in forex markets. Understanding these levels allows you to make smarter trade decisions, whether you're entering or exiting positions. For example, knowing where price tends to stop falling (support) or rallying (resistance) can help you set better stop-loss orders or take profits.
Support is a price level where a falling currency pair tends to find buying interest, causing the price to stop dropping temporarily or bounce back. Traders in Nairobi or Mombasa watching the USD/KES pair might notice that historically, at certain price points, the shilling tends to firm up against the dollar. This happens because many traders see that level as a good entry price, creating demand that outweighs supply.
Resistance is the opposite: it’s the price point where a currency faces enough selling pressure to stop its upward move. For instance, if EUR/USD rallies near 1.1200 but fails to rise past this point on several attempts, traders call this a resistance level. In Kenyan markets, resistance levels can emerge around rates where major players decide the currency is overvalued, prompting them to sell.
Resistance and support levels act like invisible barriers, guiding prices within a range. When price approaches support, it might bounce, offering a buying opportunity; when it hits resistance, it might reverse or stall, signalling a chance to sell or tighten stops. Sometimes, prices break through these barriers, signalling strong momentum – this is where breakouts become relevant.
Support and resistance are partly about trader psychology. These levels reflect collective memory – where traders previously bought or sold in large numbers. Kenyan forex traders, for example, might hesitate to sell below a strong support, fearing losses, while others may view resistance zones as ideal exit points before prices drop again.

These levels shape market trends and volatility. When many traders watch the same support or resistance, their combined actions cause price reactions that reinforce the levels’ validity. This effect can be seen during volatile sessions, like London or New York hours, where price tests these barriers repeatedly.
Support and resistance represent shifts in supply and demand. When price falls to support, demand exceeds supply, pushing price up. At resistance, supply outstrips demand, driving price down. Understanding this connection helps traders anticipate whether prices will hold or break these levels, improving timing and risk control.
Mastering resistance and support is critical because these levels stand as the blueprint for price behaviour, guiding traders through the ups and downs of forex markets, whether you're trading USD/KES or EUR/USD.
Recognising support and resistance levels isn't just guesswork; it involves careful examination of market data and patterns. Traders who understand these methods gain a sharper edge in timing their trades and avoiding traps. Here, we look at the key approaches used to identify these critical price points.
Previous highs and lows act like landmarks in the forex market. When a currency pair reaches a certain high or low in the past, traders watch those points closely because price often hesitates or reverses there again. For example, if USD/KES touched 115 previously and reversed downward, traders expect this level to act as resistance the next time the price approaches it.
Price consolidation areas show where trading activity has paused and prices have hovered within a range. These zones often reflect indecision or balance between buyers and sellers, making them natural support or resistance areas. Say EUR/USD has stayed between 1.08 and 1.10 for several days; that zone signals a battleground that could affect future price moves.
Candlestick patterns add another layer of insight. Certain formations—like hammers, shooting stars, or dojis—near support or resistance levels hint at possible reversals or continuation. For example, a hammer candlestick appearing near a support level on GBP/USD can suggest buyer strength pushing back sellers.
Trendlines and channels are drawn by connecting successive highs or lows, showing the general direction and boundaries of price movement. They help traders distinguish whether the market is in an uptrend, downtrend, or sideways move. In the Kenyan market, a rising trendline on USD/UGX could guide traders to buy near support and sell near resistance within the channel.
Moving averages smooth out price data to highlight trends over time. The 50-day and 200-day moving averages are popular for spotting dynamic support or resistance. When price approaches these averages, traders watch closely for signs of bounce or break. For instance, if USD/ZAR price falls to its 50-day moving average and then climbs back, that average acted as a support.
Fibonacci retracement levels rely on mathematical ratios to predict potential reversal points after a price move. Traders plot these levels between a recent high and low, using levels like 38.2%, 50%, and 61.8% to spot support or resistance. For example, after a rally in USD/NGN, a pullback stopping near the 61.8% retracement may indicate a good buying opportunity.
Combining historical price data with technical tools increases the accuracy of identifying strong support and resistance areas, enabling smarter trading decisions.
Traders rely on resistance and support levels to make more informed decisions in the forex market. These levels represent psychological barriers where prices tend to pause or reverse, helping traders to identify potential entry and exit points. Using them effectively can improve timing and risk management, which are critical for making consistent profits.
Buying at support usually means purchasing a currency pair when its price dips to a recognised support level. Traders expect the price to bounce back from this point because previous buying interest was strong here. For example, if USD/KES consistently finds support at 110, buying near this level could provide an opportunity for gains if the uptrend resumes. However, traders should confirm this with other indicators or price action to avoid entering before a possible breakout downwards.
Selling at resistance involves placing sell orders near a price level where upward momentum has stalled before. This level acts like a ceiling; many traders take profits here, causing prices to fall back. For instance, if EUR/UGX hits 4,100 repeatedly and reverses, it might be wise to sell or tighten stop losses near that zone. Selling at resistance helps lock in gains but requires keen attention to market momentum to avoid missing out if a breakout occurs.
Breakouts and reversals happen when prices move beyond support or resistance levels. A breakout can signal a strong trend continuation, while a reversal suggests the price is changing direction. Kenyan traders should watch these carefully because false breakouts are common, especially during lower liquidity periods, such as late afternoon Nairobi time. Confirmation through volume or other indicators helps avoid chasing false moves, which can lead to losses.
Managing risk near key levels involves setting stop loss orders just below support when buying or above resistance when selling. This practice limits potential losses if the price breaks through these levels unexpectedly. For example, if a trader buys GBP/ZAR at support 20.50, placing a stop loss at 20.40 caps the risk to a manageable amount.
Adjusting targets based on price reaction means fine-tuning take profit points depending on how price behaves around these levels. If price struggles near a resistance, the trader might set a conservative take profit slightly below it. Conversely, if the price bursts through resistance with strong momentum, extending the target further can capture bigger gains. This dynamic approach allows adapting to changing market conditions rather than sticking to rigid levels.
Using resistance and support strategically doesn’t promise wins every time, but it does help traders plan better and control risks in Kenya’s forex markets, where volatility and sudden moves often come without warning.
By understanding how and when to apply these levels, traders can develop more reliable strategies and build confidence in their day-to-day forex trading activities.
Resistance and support levels help traders spot where price might stall or reverse in the forex market. However, traders must be aware that these levels are not set in stone. Several challenges and limitations can affect their reliability, making it essential to approach them cautiously.
Identifying fake signals is one hurdle traders face. At times, the price briefly moves beyond a support or resistance level but then quickly reverses. This creates a false breakout, tricking traders into entering or exiting trades prematurely. For instance, a trader in Nairobi might see the USD/KES price rise above a known resistance, triggering a sell signal, only for the price to drop back below soon after. Such moves often occur due to short-term volatility or market orders that push the price temporarily past a level without sustained momentum.
To avoid falling for these fake signals, traders need to confirm breakouts with additional indicators or wait for a candle close beyond the level. Using volume indicators alongside can help verify whether a breakout is genuine. Higher trading volume on the breakout strengthens its validity, while low volume may mean the move lacks conviction.
Avoiding emotional trading decisions is just as important. False breakouts and regular market fluctuations can create emotional stress, leading traders to panic or chase the market. For example, a trader might quickly close a position fearing a loss after a false breakout, only to miss the real trend that follows. Practising patience and sticking to a trading plan can help curb impulsive reactions. Kenyan traders should maintain discipline, perhaps using alerts or automated orders through their broker to avoid rash decisions during intense market noise.
Adjusting levels with market shifts is necessary because support and resistance are not fixed lines. Price action evolves with new economic data, geopolitical events, and shifts in trader sentiment. A level that held last month may lose its significance as the market reacts differently. For example, during Kenya's election season, the forex market often sees increased volatility, causing support or resistance levels from earlier months to change meaning.
Traders should revise these levels regularly using fresh price data. Continuous checking ensures that strategies align with current market realities rather than outdated information. It is useful to mark recent price highs and lows every few days or weeks, depending on your trading timeframe.
Importance of ongoing analysis cannot be overstated. Forex markets run 24/7 and are affected by global news constantly. Successful traders in Kenya must keep reviewing their charts, news feeds, and economic calendars to keep support and resistance levels relevant. Relying solely on static levels without updating them leaves traders vulnerable to unexpected price swings.
Regularly updating your support and resistance levels based on the latest market data helps avoid costly mistakes and improves trade timing.
By recognising these challenges and limitations, traders can better manage risks, refine their strategies, and avoid common pitfalls when using support and resistance in forex trading.
Trading forex in Kenya offers unique opportunities and challenges. Practical tips help local traders adapt global trading concepts, like resistance and support, to the Kenyan market environment. Understanding how to combine these key price levels with other indicators and local realities can improve decision-making and boost the chance of success.
Using oscillators like the Relative Strength Index (RSI) or the Moving Average Convergence Divergence (MACD) helps confirm whether a price level is likely to hold or break. When price approaches a support level with RSI showing oversold conditions, it suggests buying pressure may build soon. On the flip side, if resistance aligns with overbought readings on an oscillator, traders might prepare to sell or expect a reversal. Adding volume indicators further reveals the strength behind price moves; a breakout above resistance with high volume is more credible than one on low volume.
Confirming trends ensures that signals from support and resistance levels aren’t taken at face value. For instance, a support bounce within a clear uptrend carries more weight than the same bounce in a sideways market. Trend confirmation tools like moving averages or trendlines give traders confidence in their entries or exits. In practice, when the 50-day moving average supports rising price and encounters a support level, it strengthens the case for buying. Kenyan traders should avoid overreacting to isolated support or resistance breaks without solid trend confirmation, as it often leads to being caught in false moves.
Kenya’s forex market hours and typical volatility patterns affect how resistance and support are tested. Volatility often increases during London and New York trading hours but slows down outside these periods. Kenyan traders may notice more price stability during local night time yet greater swings early morning. Adjusting strategy to trade actively when markets are lively and being cautious during quieter times helps manage risk better. Plus, keeping up with local economic news or events—including the Central Bank of Kenya’s policy announcements—can explain unexpected breaks through support or resistance.
The ease of executing trades is another local factor. M-Pesa, Kenya’s popular mobile money service, enables swift funding of trading accounts with minimal hassle. Choosing brokers that support local payment methods like M-Pesa or have physical offices in Nairobi fosters quick deposits and withdrawals, reducing delays. Kenyan traders should also prefer brokers regulated by bodies such as the Capital Markets Authority (CMA) for added security. In practice, this means a trader can spot a support level, confirm trend strength, and quickly act on the opportunity without waiting days for money transfers.
Mastering forex in Kenya means blending proven global technical tools with the realities of the local market cycle, payment options, and trading culture. Practical adjustments sharpen your strategies around resistance and support, reducing costly mistakes.
Use oscillators and volume to validate key price levels
Confirm trends before acting on support or resistance
Time trades to match local and international market volatility
Use familiar, fast payment methods like M-Pesa for quick trade execution
Pick trusted local brokers for regulatory assurance and support
By weaving these practical tips into your forex routine, you make resistance and support more than theory—they become reliable tools that fit the pace and pulse of Kenya’s markets.
Explore forex trading in Kenya with our detailed guide 🏦. Learn to pick the right brokers, understand regulations, and trade confidently in the local market 📊.

📈 New to forex trading? Discover key insights, practical tips, and risk management strategies designed to help beginners in Kenya trade confidently and wisely.

Learn forex trading in Kenya 🌍 with a practical guide covering market basics, key terms, strategies, risk management, and local regulations to trade confidently.

Discover top forex trading books for Kenyan traders 📚 Learn strategies, risk management, analysis, and trading psychology to boost your skills and success!
Based on 11 reviews