

Understanding Candlestick Patterns for Better Trading
📈 Learn to read candlestick patterns clearly for smarter trading decisions. Master trend insights, pattern types, and tips tailored to Kenya investors.
Edited By
Chloe Bennett
Reversal candlestick patterns are essential tools for traders seeking to anticipate changes in market trends. These patterns appear on candlestick charts, which are widely used in Kenyan stock markets and forex trading to visualise price movements over time. Recognising these patterns can help you identify when a market may switch from an uptrend to a downtrend, or vice versa.
Candlestick patterns consist of individual candles representing price action within a specific timeframe—daily, hourly, or even minutes, depending on your trading style. Each candle shows the opening, closing, high, and low prices during that period. When certain formations occur in a sequence, they signal a possible reversal in the current price trend.

Understanding the basics helps to apply this knowledge practically. For example, consider the Kenyan shilling against the US dollar during periods of economic announcements; spotting a reversal pattern early could save you from losses or unlock profits by timing entry or exit more effectively.
Common reversal candlestick patterns include:
Hammer and Hanging Man: Single candles with small bodies and long lower shadows, often signalling potential bottom or top reversals.
Engulfing Patterns: Where a small candle is followed by a larger candle that completely covers it, indicating strong buying or selling pressure.
Doji Candles: Candles with nearly equal open and close prices, reflecting indecision, often preceding reversals.
Mastering these patterns is not about seeing them everywhere but understanding their context within broader market behaviour. Combining candlestick insights with volume analysis or support and resistance levels improves your trading decisions.
In Kenya, many traders combine candlestick analysis with M-Pesa payment trends or government budget cycles to make informed moves. That said, these patterns are more reliable when used alongside other trading tools and risk management strategies.
By paying attention to reversal candlestick patterns, you can make smarter investment choices, whether you're trading at the NSE (Nairobi Securities Exchange), forex markets, or commodities like tea and coffee futures. This foundational knowledge sets you up for better timing and more confident trades in the competitive Kenyan market.
Recognising reversal candlestick patterns is a key skill for anyone trading in Kenyan markets or beyond. These patterns offer early hints that a current trend may be changing direction, allowing traders to time entry or exit points more wisely. For example, spotting a reversal pattern after a strong uptrend in NSE top stocks like Safaricom or KCB could signal a selling opportunity to protect gains.
Understanding these patterns helps you avoid chasing false breakouts or holding onto a fading trend. While they don’t guarantee outcomes, reversal candlestick patterns complement other tools like trendlines and volume indicators for better decision-making.
Reversal candlestick patterns are specific formations on price charts that suggest a shift in market momentum. They usually appear after a sustained uptrend or downtrend and hint that the direction might soon flip. In practical terms, for a Kenyan forex trader working with USD/KES pairs, identifying these patterns can mean the difference between catching a profitable market turn or facing a loss.
Their significance lies in early signalisation. Instead of waiting for confirmation through traditional indicators that may lag, traders spot these patterns visually and prepare for potential shifts, allowing quicker responses.
While reversal patterns flag a change in trend from up to down or vice versa, continuation patterns merely indicate the current trend will likely persist. For example, an engulfing pattern often signals reversal, whereas a flag or pennant pattern usually suggests continuation.
This distinction matters because responding to a reversal pattern often involves closing or reversing positions; ignoring continuation patterns might mean missing out on holding onto a winning trade. Kenyan traders must distinguish the two to adjust strategies accordingly, especially in volatile markets.
A candlestick captures four key price points for a chosen timeframe: opening price, closing price, highest price, and lowest price. The rectangular "body" spans from open to close, while the "wicks" or "shadows" stretch to show highs and lows.
In Kenyan markets, whether checking daily charts for a stock or hourly forex movements, these components depict market sentiment in that period. For instance, a narrow body with long wicks can suggest market indecision or strong testing of price levels.
Bullish candles show prices closed higher than they opened, often coloured green or white. Bearish candles indicate prices closed lower, usually red or black. The size of the candle’s body reflects momentum strength.

When a bullish candle follows a downtrend, it may hint at buyers regaining control, while a bearish candle in an uptrend could signal sellers pushing back. These insights help Kenyan traders see shifts in supply and demand quickly, forming the base for spotting reversal patterns.
Understanding these basics sets a strong foundation for spotting reversal patterns and making timely trades that fit Kenyan market dynamics.
Understanding common reversal candlestick patterns is key for traders looking to spot potential shifts in market direction. These patterns often reflect a battle between buyers and sellers, offering clues about whether a trend may change course. Kenyan investors, especially those active on the Nairobi Securities Exchange (NSE) or in currency trading, can benefit greatly from recognising these signals early. Both single-candle and multiple-candle patterns provide different levels of reliability and context, so recognising the specific type helps craft better trading decisions.
Hammer and Hanging Man
The hammer and hanging man are visually similar candlesticks with long lower shadows and small bodies. A hammer appears after a downtrend and indicates that buyers have stepped in, potentially signalling a bullish reversal. Imagine a share like Safaricom dropping for a few days and then forming a hammer—this could be your sign to prepare for a rebound. Conversely, the hanging man shows up after an uptrend and warns that sellers are gaining pressure, suggesting a bearish reversal might be near. However, context is critical: a hanging man alone isn’t enough to sell. Confirming volume or price action on the following day matters.
Shooting Star and Inverted Hammer
Both patterns feature small bodies with long upper shadows but appear in different contexts. A shooting star forms at the peak of an uptrend, signalling that buyers tried to push prices higher but lost momentum, which can lead to a downturn. For example, when a banking stock spikes with a shooting star pattern, savvy traders watch closely for drops. Meanwhile, the inverted hammer emerges after a downtrend, hinting at a possible bullish turnaround. Its unique shape suggests buyers are challenging the sellers, but again, confirmation from the next trading day is essential to avoid false signals.
Engulfing Patterns (Bullish and Bearish)
Engulfing patterns involve two candles where the second candle completely covers the first. A bullish engulfing pattern occurs when a small bearish candle is followed by a large bullish one, indicating strong buying pressure that could reverse a downtrend. This is common in volatile NSE stocks where sentiment changes quickly. On the flip side, a bearish engulfing pattern happens after an uptrend when a large bearish candle overtakes a small bullish one, warning that sellers might dominate soon.
Piercing Line and Dark Cloud Cover
These patterns also span two candles but differ slightly from engulfing patterns. The piercing line shows up after a downtrend: the first candle is bearish, but the next opens lower then closes above the midpoint of the first candle, signalling a possible bullish reversal. This subtle recovery might be visible in forex pairs like USD/KES during a market shift. Conversely, the dark cloud cover appears after an uptrend: the first candle is bullish, but the second opens higher and closes below the midpoint of the first, hinting the upward momentum may fade.
Morning Star and Evening Star
These are three-candle patterns delivering clearer reversal signals. The morning star starts with a strong bearish candle, followed by a small-bodied candle indicating indecision, then a powerful bullish candle signalling a trend change up. This pattern is useful for Kenyan traders waiting to enter long positions after confirmation. The evening star is its mirror: a bullish candle, followed by hesitation, then a bearish candle, signalling a downtrend onset. Recognising these can aid timing exits or short sales.
Spotting the right reversal pattern, and understanding its place in a broader market context, can enhance your trading confidence and timing, especially in Kenya’s diverse financial markets.
By mastering these common reversal candlestick patterns, you build a solid foundation for reading market signals effectively.
Recognising reversal candlestick patterns in Kenyan financial markets involves understanding local market behaviours, especially those on the Nairobi Securities Exchange (NSE) and forex markets that include the Kenyan shilling. This knowledge allows traders and investors to time their trades better, avoiding false signals and improving profitability. The Kenyan market has its quirks, shaped by factors like liquidity levels, influential economic reports, and dominant sectors such as banking and telecommunications, so identifying patterns here requires adapting general candlestick principles for local conditions.
The NSE is dominated by a handful of large-cap stocks like Safaricom, Equity Bank, and KCB. These stocks often experience clear trend shifts reflected in their candlestick charts. For example, a bullish engulfing pattern after a downtrend in Safaricom shares might suggest a strong reversal backed by institutional buying, given its market influence.
However, some NSE stocks, especially mid or small caps, show choppier behaviour with frequent false reversals due to lower trading volumes. Traders should watch volume alongside candlestick patterns to confirm moves. The price action around critical corporate events like quarterly earnings or government policy announcements often amplifies these signals.
Forex trading with Kenyan shilling pairs such as USD/KES or EUR/KES adds complexity. The shilling can be volatile, especially during periods of macroeconomic news like Central Bank of Kenya (CBK) monetary policy decisions or inflation reports. Here, reversal patterns like the morning star or hammer can signal potential trend shifts when the shilling weakens or strengthens rapidly.
Since forex markets operate 24 hours and react quickly to global news, Kenyan traders should combine candlestick signals with real-time economic data and monitor the shekel’s response during Kenyan market hours. Pairing patterns with technical indicators like the Relative Strength Index (RSI) offers improved accuracy in timing entry or exit points.
Volume confirms the strength of reversal patterns. For example, a bullish engulfing pattern in KCB shares becomes more trustworthy if accompanied by higher-than-average volume, indicating genuine buying interest. Kenyan traders can also use moving averages to track momentum shifts and the RSI to spot overbought or oversold conditions that fit with candlestick signals.
Besides volume, other indicators such as the Moving Average Convergence Divergence (MACD) or Bollinger Bands can validate potential reversals. Combining these tools helps avoid taking positions on weak patterns that may fail to reverse the market.
Trend context is crucial. Reversal patterns carry more weight when they appear near established support or resistance zones. For instance, a hammer pattern forming on Safaricom stock near a previous low supports the idea of a trend bottom.
Support and resistance levels act like battle lines for price. A reversal pattern breaking above resistance usually confirms a bullish move, while one failing near resistance might just be a pause. Kenyan traders should map these levels on NSE and forex charts before acting on candlestick signals to reduce the risk of false breakouts.
Accurate identification of reversal patterns in Kenyan markets depends not only on reading the candlesticks but also on understanding volume, technical indicators, and price levels. This approach sharpens trading decisions and boosts confidence amidst market fluctuations.
Trading successfully with reversal candlestick patterns requires more than just spotting them on a chart. You need a solid plan that blends these patterns with sound risk management and a good sense of when a reversal signal is reliable. Without this, even the most well-known patterns can lead to losses. For Kenyan traders, being cautious and deliberate can save you from common pitfalls, especially when market volatility can be sharp around quarterly earnings or economic announcements.
Setting stop-loss levels is essential to protect your capital when trading reversals. Since reversal patterns indicate a possible change in trend, they are not always confirmed immediately. For instance, if you spot a hammer candlestick at a support level in NSE blue-chip stocks like Safaricom, placing a stop-loss just below that support can limit your losses if the market doesn't turn as expected. This approach helps you avoid big setbacks if the price continues against your position.
Position sizing for reversals matters because reversal trades can be riskier than straightforward trend-following ones. To manage this, many Kenyan traders allocate smaller portions of their trading capital for reversal setups. For example, if you typically put 10% of your portfolio on a trade, consider reducing to 5% when acting on a reversal signal alone. This cautious sizing provides room for the trade to play out without risking too much, especially in forex pairs involving the Kenyan shilling, where liquidity might not be as deep as in major currencies.
One common mistake Kenyan traders make is jumping into trades as soon as a reversal pattern appears without waiting for confirmation. For example, entering on a single hammer candle without checking volume or subsequent price actions often leads to false entries. Other mistakes include ignoring broader market trends or trading after hours when liquidity is low, making the signals unreliable.
To steer clear of false alarms, validating patterns with market conditions is vital. Look at factors such as trading volume, overall trend, and support or resistance zones. If a bullish engulfing pattern forms near a known resistance in the NSE 20 Index but on low volume, it might not hold. Conversely, a reversal pattern confirmed by increasing volume and alignment with a long-term support area is more trustworthy. Likewise, for forex traders dealing with KES/USD or KES/EUR pairs, checking macroeconomic news like CBK interest rate announcements helps understand if reversal signals have context or are likely to fade.
Effective trading with reversal candlestick patterns blends clear pattern recognition with smart risk controls and market awareness. This approach increases your chances of making profitable decisions and reduces costly mistakes.
By combining these practical tips, you position yourself more towards consistent success rather than relying on guesswork or hope alone.
Reversal candlestick patterns offer valuable insights into potential market turning points. However, relying on them without understanding their limitations can lead to poor trading decisions. These patterns are not foolproof indicators; they must be used cautiously and alongside other tools to avoid false signals and costly mistakes.
Candlestick patterns indicate possible market direction changes, but they do not guarantee outcomes. For example, a bullish engulfing pattern might appear during a downtrend, but the market could still continue falling due to overriding factors such as weak economic data or sudden geopolitical events. Traders who act only on the pattern without further confirmation may end up entering a losing trade.
In practice, candlestick patterns are best viewed as warning signs rather than certainties. They highlight areas to watch closely but should not be the sole basis for trading decisions. Kenyan traders have sometimes fallen into this trap, entering positions based on pattern signals only to see the price move against them, especially in volatile markets like forex pairs involving Kenyan shillings.
Combining candlestick analysis with other methods improves the reliability of signals. For instance, checking moving averages, relative strength index (RSI), or support and resistance levels alongside reversal patterns gives a fuller picture of market sentiment. Confirming a pattern with increasing volume or alignment with a key fundamental event often strengthens the case for a trend reversal.
Economic news and geopolitical developments can override what candlestick patterns suggest. In Kenya, announcements like Central Bank of Kenya (CBK) monetary policy decisions or election-related events frequently cause sharp market moves. Even a well-formed reversal pattern might fail if, say, inflation figures come out higher than expected or global commodity prices shift abruptly.
Volatility and market liquidity also affect how dependable reversal patterns are. In thinly traded stocks on the NSE or during slow trading hours, patterns may produce misleading signals due to erratic price movements. Likewise, sudden spikes in volatility—common during earnings reports or political upheaval—can cause patterns to break down before they play out completely.
Successful traders understand that reversal candlestick patterns are useful tools but not crystal balls. The best approach is to combine them with other analysis and keep an eye on broader market events.
By recognising these limitations and adjusting strategies accordingly, Kenyan traders can better manage risks and avoid being misled by candlestick patterns alone.
📈 Learn to read candlestick patterns clearly for smarter trading decisions. Master trend insights, pattern types, and tips tailored to Kenya investors.
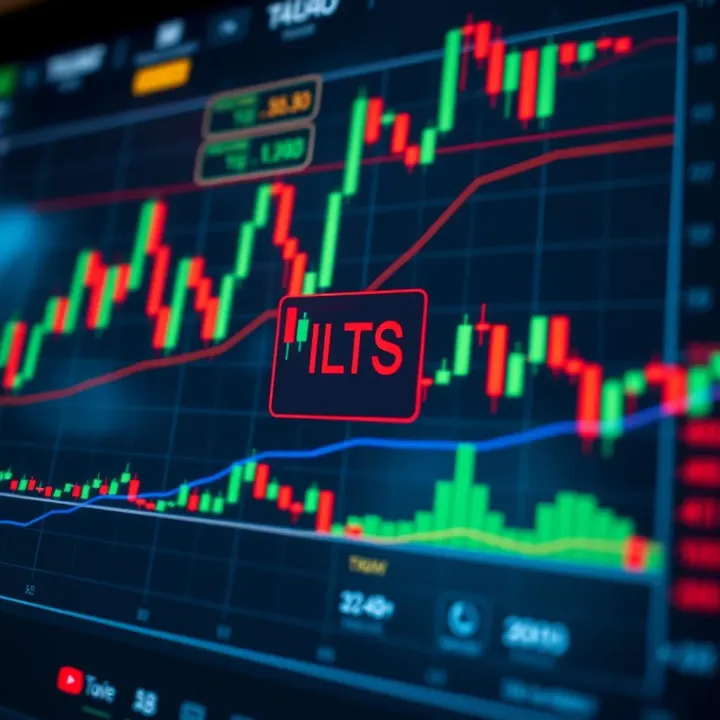
📈 Learn how to read forex candlestick patterns for smarter trading decisions. Discover key patterns, strategies, and tips to navigate the forex market confidently.

📈 Learn how to read candlestick patterns in forex trading to spot market moves, improve timing, and manage risks like a pro in Kenya's forex market.

Learn to spot bullish candlestick patterns 📈 for smarter trading decisions in Kenya's markets. Understand patterns, signals, and techniques for better accuracy.
Based on 8 reviews